


Thermographic inspection of PV systems
Defective modules cost yield and cannot be seen from the ground. The thermal drone finds hotspots while the system is running.
Cracked cells, defective bypass diodes or failed modules hardly stand out in everyday operation. At most they show up as a slightly lower yield, and there are many possible causes for that. In a thermal image, however, such faults are clearly visible as warm spots on the modules. The drone flies over your system during normal operation. Nothing needs to be switched off, and nobody has to go up on the roof.
What you get
You choose how detailed the result should be:
Photo and thermal image
The simplest option: an oblique photo and a thermal image of the system that show any anomalies.
Orthophotos
A true-to-scale top view of the entire system, in true colour and as a thermal image, with every module in its place. This is the basis for a meaningful analysis.
PDF map
An overview map of the system or detailed maps for each roof area, with all anomalous modules marked.
Module list
Every anomalous module with a unique position and the matching thermal image, so your service partner knows straight away where to go.
What the thermal image shows
- Individual hot cells: an indication of cracked cells or localised soiling
- A warmer section within a module: an indication of an active or defective bypass diode
- Entire modules or rows of modules warmer: an indication of a disconnected module, a connector fault or a failed string
- An even image: that is a result too. It confirms that your system is in good order, for example after a hailstorm or before a purchase.
Getting reliable results
- Enough sun: I only fly at an irradiance of at least 600 W/m², measured on site. Only then do faults show up reliably.
- System under load: the inverter must be delivering power, without curtailment due to a full battery or a feed-in limit.
- No false alarms: I capture conspicuous spots from a second angle and check them zoomed in, so that leaves, bird droppings or a reflection are not mistaken for a defect.
- Precisely located: with RTK positioning, every anomaly can be assigned unambiguously to a module.
- Fine resolution: around 2 cm per pixel in the thermal image.
- Traceable: irradiance, air temperature, humidity, cloud cover, wind and inverter output at the time of the flight are included in the report.
How a project works
- Enquiry: You send me the location, system capacity and number of modules. The module datasheet and, if available, the string plan are helpful.
- Preparation: I clarify the airspace and approvals, plan the flight and look for a time window with suitable irradiance.
- On site: I measure irradiance and weather conditions and briefly talk with you about known problems or drops in yield.
- Survey flight: The drone flies over the system with a thermal and true-colour camera. A typical rooftop system is done in less than an hour; large systems can take longer.
- Check: While still on site, I check that the whole system has been captured sharply and immediately re-fly any gaps.
- Report: I analyse the images, mark every anomalous module and deliver the agreed results, from the thermal image to the PDF map with module list.
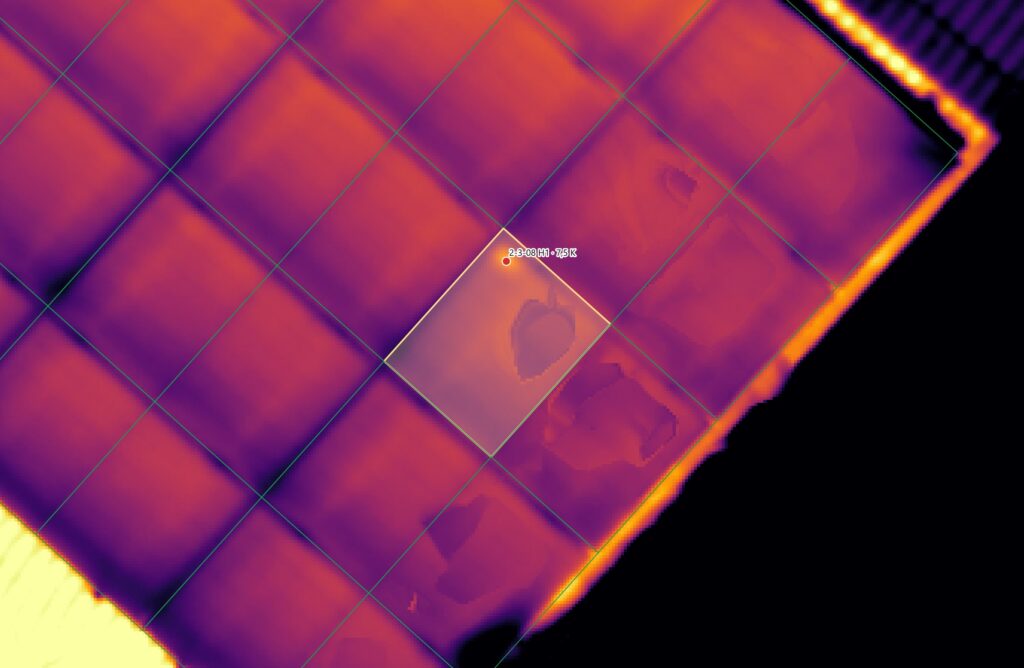
Thermal image of a PV system: a hotspot on a module that was detected and marked automatically.
Your PV system under the thermal camera?
Send me a short message about your system. I’ll get back to you with a proposal.