

Remote sensing and satellite image analysis
How has an area changed? Satellite and multispectral data reveal vegetation, land use and damage across large areas and long periods.
Satellites capture every area regularly, and have done so for decades. This reveals what is hard to record from the ground: how forests, meadows and water bodies develop, where storms, drought or fire have left damage and how land use changes. For large areas and long time series, I work with Google Earth Engine, among other tools. I prepare the results so that you can work with them directly.
What you get
Vegetation indices
Indicators such as the NDVI show how vital the vegetation is. Other indices provide clues about soil moisture or water surfaces.
Time series
How an area has changed over months or decades, with imagery going back to the 1970s.
Habitat classification
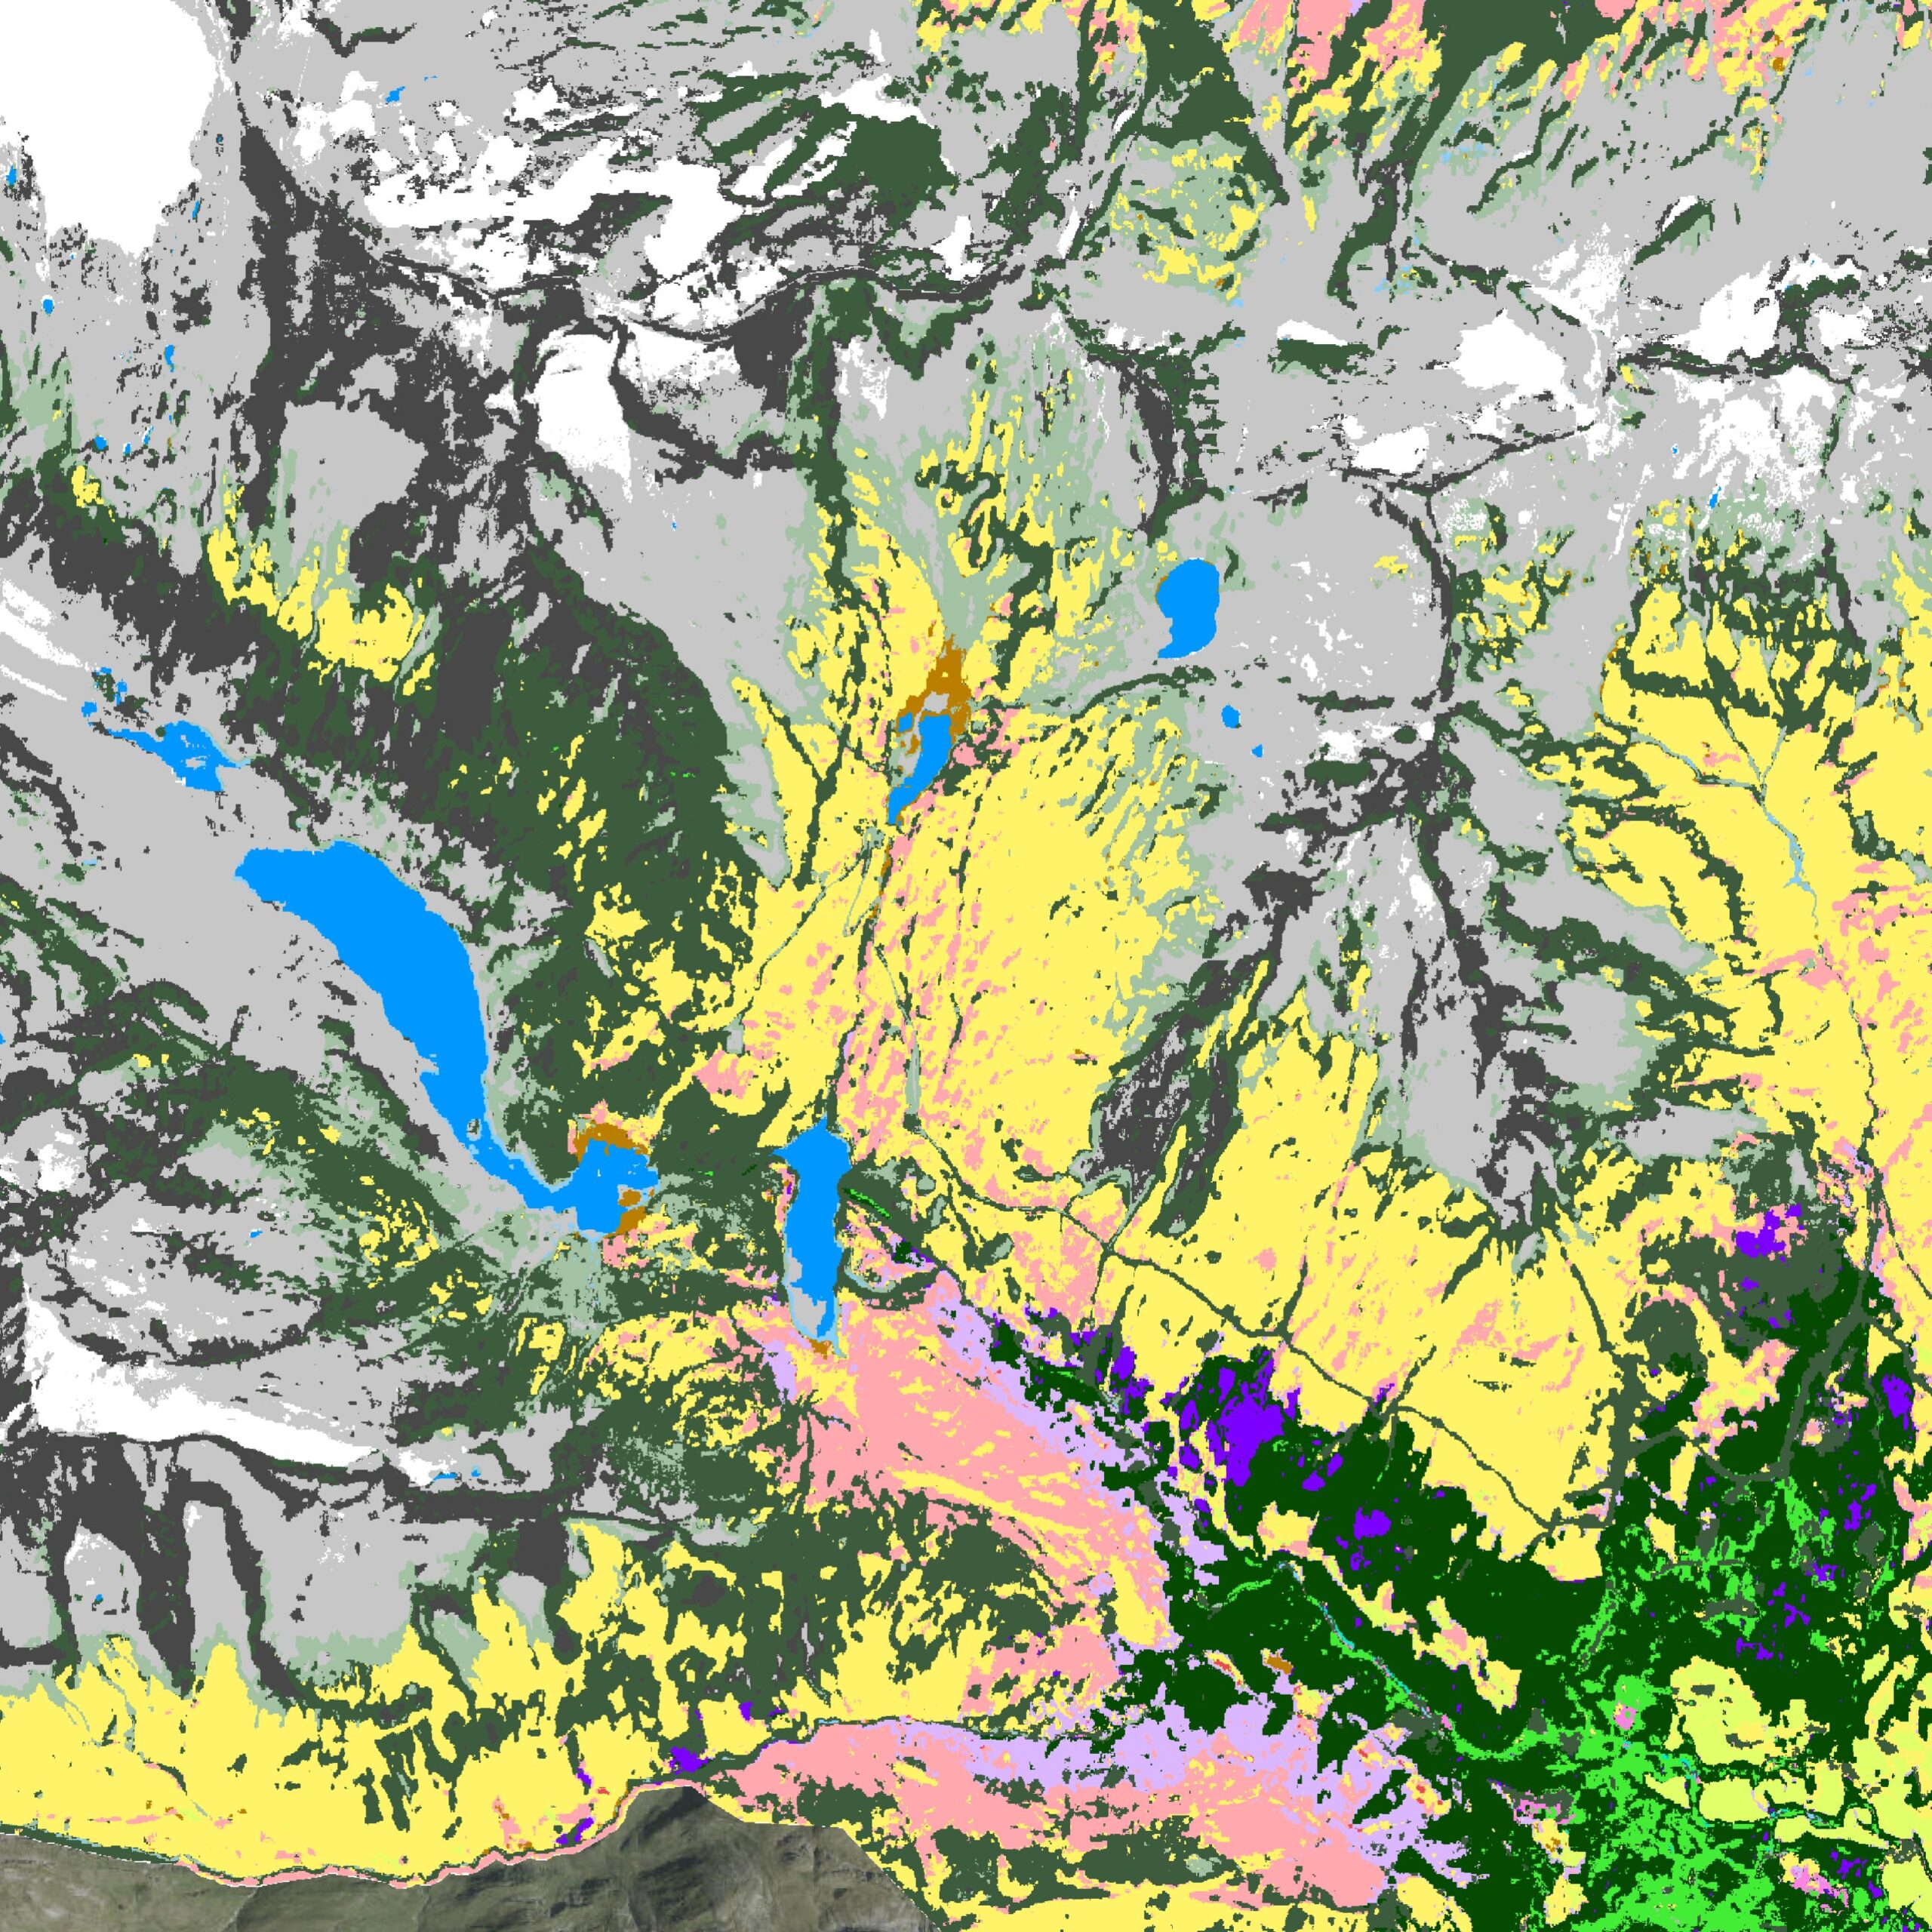
Full-coverage maps of habitat or land-use types, derived with machine learning from satellite images, elevation data and other sources and validated against reference areas.
Typical questions
- Forest damage: detecting and delineating damage after storms, drought or bark beetle infestation
- Burnt areas: mapping the extent of a fire and tracking how the vegetation recovers
- Habitats: documenting changes over the years, for example in meadows, bogs or floodplains
- Land use: recording land-use types and soil sealing across entire areas
- Vegetation through the year: observing development over the season, for example for agriculture or nature conservation
The data I use
- Sentinel-2: freely available satellite images from the European Copernicus programme, 10 m resolution, new every few days
- Landsat: an image archive going back to the 1970s, ideal for long time series
- High-resolution satellite images: on request, when details matter
- Drone data: for smaller areas with centimetre resolution, also multispectral
How a project works
- Enquiry: You describe the area, the period and what you want to know.
- Coordination: We clarify which data and resolution will answer your question and which results you need. You then receive a quote.
- Data: I select suitable images with as little cloud cover as possible and prepare them.
- Analysis: I calculate indices, time series or classifications and check the results against reference areas.
- Delivery: You receive maps, charts and the data itself, with a short report on request.
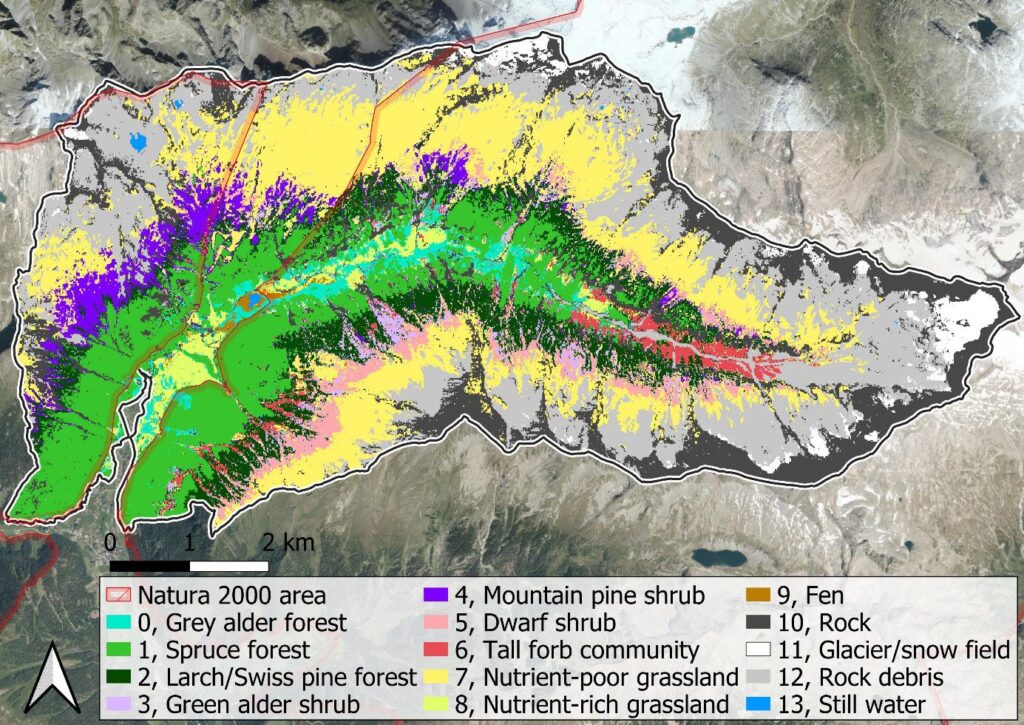
Classification result based on satellite data, from a publication I contributed to.
How has your area changed?
Send me a short message about what you need. I’ll get back to you with a proposal.